Expected goals has moved from niche stat to mainstream lens for understanding how La Liga teams really perform across a season, especially once you bring xGA into the picture. In 2024/25 the numbers behind Barcelona, Real Madrid, Atlético and the rest reveal patterns that raw scorelines often hide, and those patterns matter whether you are analysing tactics, future results, or long-term trends.
Why xG and xGA Explain La Liga Better Than Scores
In a league where many matches are decided by one goal, a single deflection, woodwork hit or goalkeeping error can completely distort how a game “looks” in the table. Expected goals (xG) assigns a probability between 0 and 1 to each shot based on factors such as location and shot type, then sums them to estimate how many goals a team should score given its chances, independent of finishing luck. Expected goals against (xGA) applies the same logic to chances conceded, so you can see not just who wins, but who consistently creates and prevents high-quality opportunities over time. When you extend this across an entire season, xG and xGA describe a process, and processes tend to repeat more reliably in future than individual lucky or unlucky moments.
What xG and xGA Actually Measure in Practice
To make sense of La Liga through these metrics, you need to grasp what they are really counting and what their limits are. Expected goals models are built from thousands of historical shots and estimate the likelihood of scoring from a given situation, so a close-range central shot might carry an xG of 0.4 whereas a long-range effort might carry 0.03. Summing all those probabilities across matches yields a team total for xG, and doing the same for chances conceded yields xGA, so a side can end a match with, for example, 2.1 xG for and 0.7 xGA against even if the final score was only 1–0. Over a season, comparing goals to xG (and goals conceded to xGA) shows which teams are overperforming or underperforming their underlying chance quality, hinting at whether their current league position is sustainable or likely to regress.
La Liga 2024/25: Attacking Profiles Through xG
The 2024/25 La Liga campaign has been shaped by attacking units whose xG numbers demonstrate both stylistic identity and depth of chance creation. Barcelona stand out with the highest expected goals in the league, with estimates around 31.2 xG at an early stage suggesting they are on track for over 90 expected goals if they maintain that rate, significantly higher than their league-leading total from the previous season. Real Madrid and Villarreal also sit near the top of the xG rankings, reflecting sustained volume and quality of shots even in games where they have failed to finish clinical moves. When a team consistently posts high xG, it usually indicates robust attacking structure—patterns of play that repeatedly generate good shooting positions—so short-term finishing slumps are more likely to correct than persist.
Comparing Attacking and Defensive Numbers
Looking at attack without defence misses half the picture, so combining xG and xGA reveals which teams truly control games. Teams with strong xG but weak xGA often play open football that can produce high-scoring matches but leaves them exposed, while sides with modest xG and excellent xGA may rely on cautious structures that grind out narrow wins or draws. The balance between these two numbers—xG for and xGA against—captures whether a team’s positive results stem from dominance, opportunism, or mere variance, and whether mid-table sides are quietly building the profile of future contenders.
An illustrative snapshot of how key La Liga teams combine xG and xGA in 2024/25 looks like this:
| Team | Approx. xG Trend | Approx. xGA Trend | Key Interpretive Note |
| Barcelona | Highest in league | Solid but not elite | Dominant chance creation, defence good enough to support title push. |
| Real Madrid | High but below Barça | Strong xGA | Slightly less explosive in attack, more control through suppression. |
| Atlético | Moderate xG | League-best xGA band | Defence-first profile; win by conceding very few quality chances. |
| Villarreal | Upper-tier xG | Mid-range xGA | Proactive attack but more vulnerable without the ball. |
This kind of simple table hides a lot of nuance but shows at a glance which sides rely more on attack or defence, and it also hints where shifts in fortune—better finishing, small tactical tweaks, or injuries—can change the balance over the rest of the season.
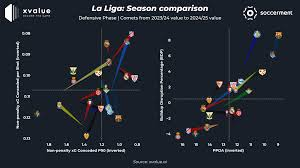
Defensive Strength: Reading xGA Leaders
If you want to identify the teams that are hardest to break down, xGA provides a cleaner signal than raw goals conceded because it strips out one-off wonder saves and finishing errors from opponents. In the 2024/25 season, Atlético Madrid sit among the leaders for lowest xGA, with Mallorca and Getafe also appearing near the top of that ranking, meaning they consistently restrict opponents to low-quality chances even when they concede the occasional goal. Such teams often show compact shape, disciplined pressing triggers and strong control of the penalty area, which suppresses central, high-value shots and forces opponents to shoot from distance or wide angles. Over a long campaign, that kind of defensive profile tends to translate into steady accumulation of points, fewer collapses under pressure, and a better platform for late-season runs once attacking form improves.
When xG and xGA Mislead or Overpromise
Despite their usefulness, xG and xGA can give a false sense of certainty if they are treated as self-contained truth rather than context-dependent metrics. Models may not fully capture late-game states where a leading team deliberately concedes harmless shots, nor do they handle all tactical wrinkles, such as set-piece routines or elite finishing repeatability, with perfect precision. Short runs of fixtures can also exaggerate variance: a side might post high xG in a few chaotic matches or concede a flurry of penalties that inflate xGA, creating a misleading impression if you do not examine longer windows and match footage. For La Liga 2024/25, interpreting Barcelona’s huge attacking xG or a mid-table club’s negative xG–xGA differential demands an understanding of schedule difficulty, injuries, and managerial changes, not just a glance at one metric on a leaderboard.
Data-Driven Betting Perspective on La Liga 2024/25
Viewing La Liga through a data-driven betting lens shifts attention from what has happened to what is likely to happen next given the underlying numbers. Bettors who track multi-match trends in xG and xGA can identify clubs whose performances are stronger than results suggest—high xG and low xGA but modest point totals—making them candidates for future upward correction in both table position and odds pricing. Conversely, a team racking up wins despite mediocre xG and poor xGA may be living on borrowed time, especially if they rely on extraordinary goalkeeping or clinical finishing that historically tends to regress toward average levels. In 2024/25 La Liga, carefully comparing these underlying metrics with how bookmakers adjust prices round by round is one way to separate genuine improvement from temporary hot streaks.
Within this analytical frame, there are moments when the public narrative around a club diverges sharply from what underlying numbers suggest, creating a kind of tension between perception and process that serious bettors watch closely. In such situations, those who track xG and xGA trends over several weeks can often spot value before prices move, especially when popular sides underperform on chance quality while still sneaking wins that keep casual confidence high. Once this gap becomes obvious and market odds eventually correct, a data-savvy audience may look to a well-established betting interface such as แทงบอล to implement their conclusions, but the core edge still comes from the ability to distinguish noisy results from stable, repeatable performance indicators in La Liga’s evolving landscape.
Using xG and xGA to Frame Match Scenarios
xG and xGA become even more powerful when they are used not just to rate teams overall but to anticipate how different matchups might play out. A clash between a high-xG, high-xGA side and a low-xG, low-xGA opponent tends to produce sharp stylistic contrasts: one team pushes forward at the cost of exposure, the other prioritises structure and risk management, and the resulting game flow is often visible in expected goals timelines. Similarly, when two elite defences with strong xGA records face each other—such as Atlético and another compact side—the likely scenario is a tight match where small tactical adjustments or set pieces weigh more heavily than usual in both xG and actual goals. Over the 2024/25 campaign, repeatedly recognising these patterns helps you forecast not just winners, but also tempo, shot volumes, and which players might see more or fewer high-quality chances.
From another angle, there are also fixtures in which underlying numbers warn against simplistic conclusions drawn from recent final scores alone. A team coming off a 3–0 defeat might actually have generated 1.5 xG while conceding only 1.2 xGA, with the scoreline distorted by one early mistake and late counter-attacks once they chased the game, while their next opponent could have won 1–0 despite losing the xG battle by a large margin. Thinking in those terms encourages a more scenario-based view: was the previous match state-driven, were there red cards, did an early goal flip the risk calculus, and are those conditions likely to repeat? Using xG–xGA lines alongside tactical context makes pre-match expectations more rooted in structural tendencies than in emotional reactions to the most recent results.
xG, xGA and the Broader casino online Ecosystem
Beyond La Liga itself, the use of xG and xGA is increasingly woven into the broader digital environment where fans, analysts and bettors interact with football. Many people now cross-check traditional statistics with advanced metrics before making decisions, and this behaviour extends into spaces where money and risk are involved, especially when live data visualisations and shot-quality charts are easily accessible on multiple devices. In that wider context, the presence of a casino online website that integrates detailed team metrics can change how users think about matches, since the interface no longer presents odds and fixtures in isolation but embeds them in a narrative about chance quality, defensive solidity and long-term form that is shaped by xG and xGA rather than simple win–loss records.
Summary
For La Liga 2024/25, xG and xGA provide a lens that explains why certain teams dominate, struggle, or fluctuate beyond what the league table alone reveals. Barcelona’s leading attacking xG, Atlético’s standout xGA, and the mixed profiles of clubs like Villarreal or Mallorca show how underlying chance quality defines their real competitive identity over a long season. These metrics are not perfect and must be read in the light of tactics, match states and sample size, yet they consistently separate sustainable performance from short-term variance when used carefully. For anyone taking a data-driven view of La Liga—whether as an analyst or a bettor—xG and xGA turn isolated scorelines into a coherent story about process, probability and realistic expectation.